Eyetracking w UX
Metody śledzenia ruchu gałek ocznych rozwijane są od ponad 100 lat. Pomagają badaczom z różnych dziedzin odkryć problemy zależne od wzorów patrzenia na obiekty. Ruchy oczu wskazują ludzkie preferencje, czynniki i bodźce wpływające na decyzje.
Proces patrzenia na obiekty statyczne składa się naprzemiennie z ruchów sakkadowych (przeskakiwania wzrokiem po danej przestrzeni w poszukiwaniu interesujących elementów) i fiksacji (skupienia uwagi na konkretnym obiekcie i przyswajania informacji). W ten sposób, spojrzenie po spojrzeniu, każdy użytkownik buduje w głowie obraz, sens i kontekst tego, z czym się styka.
Jakie zalety ma eyetracking w UX?
Badaczy UX interesuje konkretnie wzór naturalnego poruszania się użytkownika wzrokiem po interfejsie. Wiele problemów z użytecznością polega na nieprawidłowym dopasowaniu designu lub rozmieszczenia elementów do podświadomych oczekiwań użytkownika. Eyetracking jest jedyną metodą w katalogu User Experience, która eliminuje konieczność budowania założeń na temat obserwacji w oparciu o zachowania użytkownika. Zamiast tego otrzymywane są konkretne informacje do analiz:
- miejsca w interfejsie, na których użytkownik skupia się najczęściej i strefy pomijane,
- czas fiksacji wzroku na każdym obiekcie,
- drogi, którymi przeskakuje wzrok od fiksacji do fiksacji.
Analiza tych danych wskazuje kolejność poznawania interfejsu, elementy najsilniej kształtujące User Experience oraz potencjalny wpływ wielkości, rozmieszczenia czy kolorystyki elementów na przykuwanie uwagi lub przeciwnie.
Jak przeprowadzane są badania eyetrackingu?
W scenariuszu stacjonarnym badanie wymaga organizacji miejsca i sprzętu. Potrzebne są co najmniej dwa zestawy komputerowe z dużymi ekranami, głośnikami i mikrofonami, nośnik do stworzenia kopii zapasowej i tracker sprzętowy – np. Tobii Pro Spectrum. Sprzęt jest wyposażony w delikatną elektronikę i wymaga precyzyjnej konfiguracji, która w skrajnych przypadkach trwa do dwóch dni.
Badanie właściwe rozpoczyna się po serii testów ustawień. Przebiega według przygotowanego wcześniej scenariusza, z udziałem listy zadań dla użytkownika. Ważne, żeby stanowiska badacza i uczestnika były odseparowane w celu uniknięcia dystrakcji i zaburzania wyników.
Badanie zamyka się w obrębie kilku procesów przeprowadzanych przez tracker:
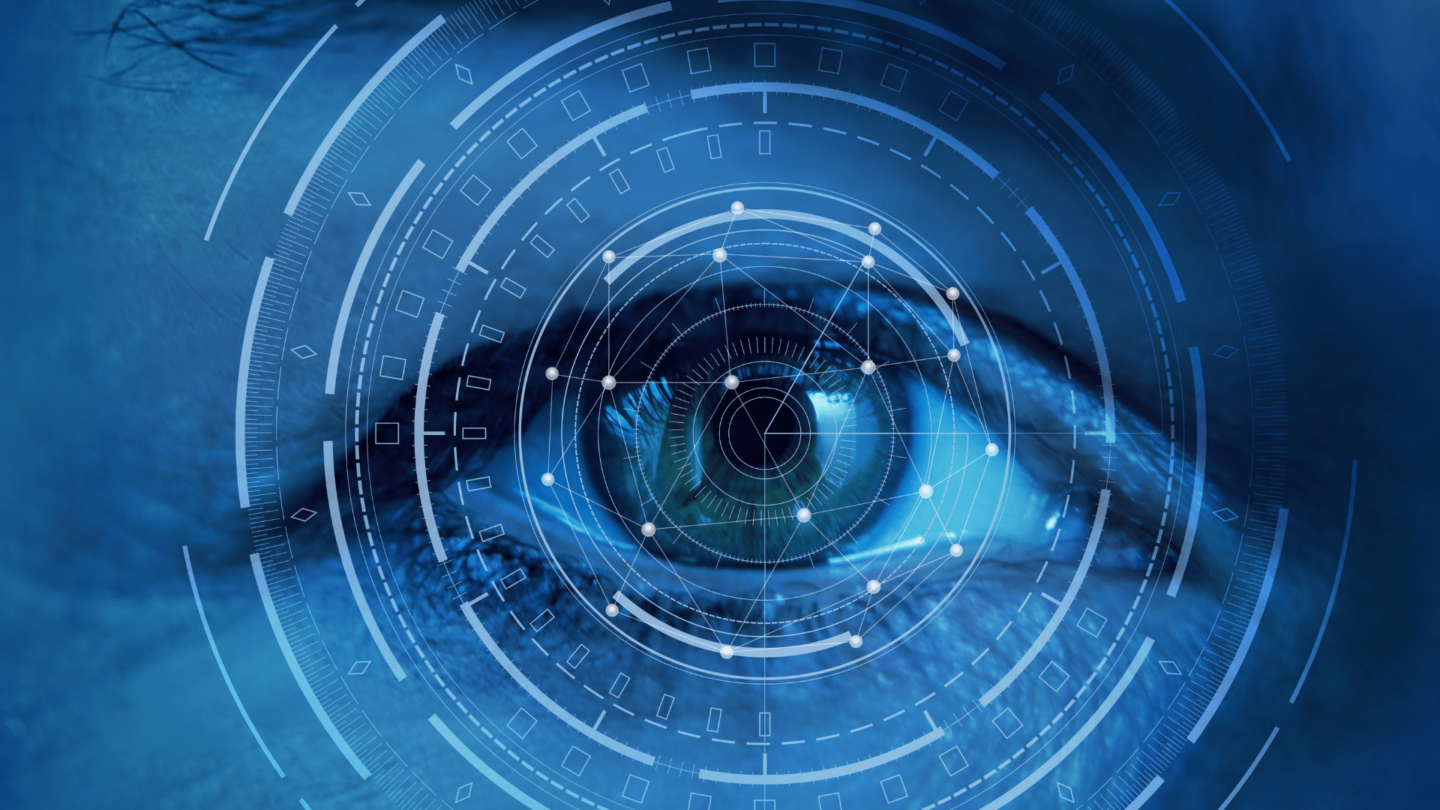
- Oświetlanie oczu uczestnika światłem podczerwonym, aby uzyskać odbicie obserwowanego obrazu,
- rejestrowanie ruchów oczu przez kamerę śledzącą,
- przyporządkowanie odczytów do obszarów w interfejsie za pomocą oprogramowania.
Wyniki badań prezentowane są na tle UI, w jednej z dwóch form:
- Ścieżki skanowania (dane jakościowe) – kolejność ruchów gałek ocznych w trakcie zapoznawania się z interfejsem. W formie wizualizacji statycznej (gaze plot) albo zapisu wideo / nakładania ścieżki w czasie rzeczywistym (gaze replay)
- Mapa hot spotów (dane ilościowe) – wizualnie przypomina mapę ciepła i wskazuje stopień zaangażowania uwagi grupy badanych w każdym obszarze interfejsu.
Obecnie eyetracking przeprowadza się także w trybie zdalnym – online. Służy do tego oprogramowanie sprzężone ze standardową kamerką internetową (np. xLabs, GazePointer, openEyes, ITU Gaze Tracker).
Można dzięki niemu szybciej, choć z niższą dokładnością badać duże grupy użytkowników przez ich własne komputery, a czasem także smartfony.
Podsumowanie
Eyetracking pozwala zobaczyć interfejs z perspektywy użytkownika i sprawdzić skuteczność projektu produktu cyfrowego w zakresie widoczności np. elementów nawigacyjnych; długości czy użyteczności contentu, a także łatwości odnajdowania szukanych treści na podstronach.
Tą drogą nie można się dowiedzieć, jak bardzo istotne były dla uczestnika badania konkretne elementy ani dlaczego właśnie na nie zwrócił uwagę.
Natomiast w połączeniu z innymi badaniami, eyetracking daje pełniejszy obraz User Experience. Porównanie wzorów skanowania treści przez różnych uczestników oraz analiza ścieżek podążania wzrokiem po interfejsie, pozwala dostosować wygląd i rozmieszczenie elementów, aby ułatwić użytkownikom poruszanie się po interfejsie i skrócić drogę do celu.